
DATAVIZ
Public portal for DHIS2

D2D
Communication between DHIS2 databases

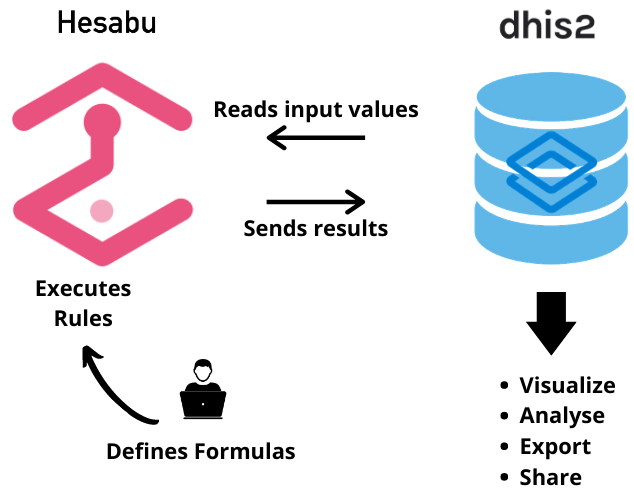
HESABU
DHIS2 computation engine

PBF MANAGER
PBF invoice manager

LOGISTICS
Supply chain monitoring

TASKR
DHIS2 shortcuts toolbox

FEEDBACK LOOP
Sending automated reports

A spreadsheet on top of DHIS2
The issue: a need for strong computation features
As the users and implementers of many DHIS2 data systems, we identified a gap in the needs of data managers. Specifically for more complex computations, for example generating a single invoice for a facility can require applying 50+ rules, most of them building on each other, and hundreds of raw values. These computations are essential for various health programs such as Results Based Financing, LMIS/Supply Chain, or Monitoring & Evaluation and modeling.
Therefore, we decided to build a powerful open source computation engine on top of DHIS2 to address that need.
Our solution: an Excel sheet running on top of DHIS2
Hesabu does not replace DHIS2 indicators, instead it enhances them. It offers additional capabilities with more advanced formulas, the capacity to use data from sibling or parent org units and sliding periods.
Think of it as an Excel sheet running on top of your DHIS2 – you can define formulas, apply formulas to the output of other formulas in order to create a whole chain of transformation and, more importantly, send any result (final or intermediary) back to DHIS2 as a normal data element value.
Hesabu does not replace DHIS2 indicators, it enhances them
Through Hesabu, the data manager retains the authority and flexibility of the rule engine. At the same time, other users can use the results, as they would any other value (raw or computed through an indicator), into any DHIS2 module. Through reports, pivot tables, charts, etc, without ever needing any additional software or complexity and thereby staying in the environment they know and love.

Why should you use it?
Improves data usage
Hesabu truly enriches the ability for Program Managers in their use of DHIS2 and give them access to new data elements that can be used for subsequent analyses, calculations or visualization. With that engine, they can:
- Create formulas using your data from the necessary org units, data elements and periods.
- Use the result of one formula to feed into a new one thus building complex indicators.
- Run the formulas automatically on a regular basis.
- Send all relevant results back to DHIS2 as normal data values so everyone can exploit them using DHIS2 reporting capabilities.
Improves Data and quality analysis
Hesabu will help gather relevant information and analysis that will then help project administrators in their decision-making process.
For example, it can provide:
- Automated sample selections to verify data (based on best available data)
- Evaluation of trends
- Easy monitoring and evaluation of the program.
- Information on how a specific health center has evolved over time.
- Comparison on health centers within the same group (regions, etc.)
- Automatic verification of the data

Enhances decision making
Those computations allow for the creation of values that can easily be integrated into reports or visually to provide stakeholders with insights that facilitate practical decision making by identifying health issues and helping them to respond to questions such as “how is this health zone performing compared to others?” or “where should we prioritize our money/support?”
A tailored tool for various programs
While initially developed to tackle Performance-Based Result programs needs, Hesabu responds to various and broader cases for instance:
- Performance-Based Result/Strategic purchasing programs: Calculating accounts payable to a specific facility (health center, school or other services entities), taking into account the amount of service offered, a detailed quality measure, past performance or even comparisons with similar facilities.
- Logistics/supply chain: Predict stock-out risks based on health center activities and inventory movements, even when data are inconsistent over time, due to complex data collection environments.
- Measure & Evaluation: Taking data availability into consideration when analyzing the trends of indicators, computing complex measurements (thresholds, multi-conditional indicators, scores, etc.), performing advanced data quality and consistency checks, as well as identifying outliers directly in DHIS2.
Hesabu in numbers
- 29 programs in 12 countries
- 2 programs use it to support supply chain monitoring: SANRU and CORDAID in DRC
- 3 programs in DRC use it to support large scale monitoring and evaluation: the Health System Strengthening for Better Maternal and Child Health Results Project, the USAID Integrated Health Program and the COVID-19 Response.